
Welcome to ThinkIQ
ThinkIQ builds a digital twin of your manufacturing operation: a model of your plants, equipment and materials, joined to the live data that comes off the plant floor. Everything you see here is organised around that model.
1. Model it
Describe what you make and what you make it with: equipment types, the equipment you have, and how it is connected. You define it once and every other part of the platform uses it.
2. Connect it
Install the Gateway next to your data sources and connect them to your equipment. Readings arrive with their time and quality, are stored as history, and appear in the model as they happen.
3. Use it
Look at the process, trend its behaviour, trace material, run your own scripts, or read the data from your own systems through the platform's interfaces.
What you can do here
Model Explorer
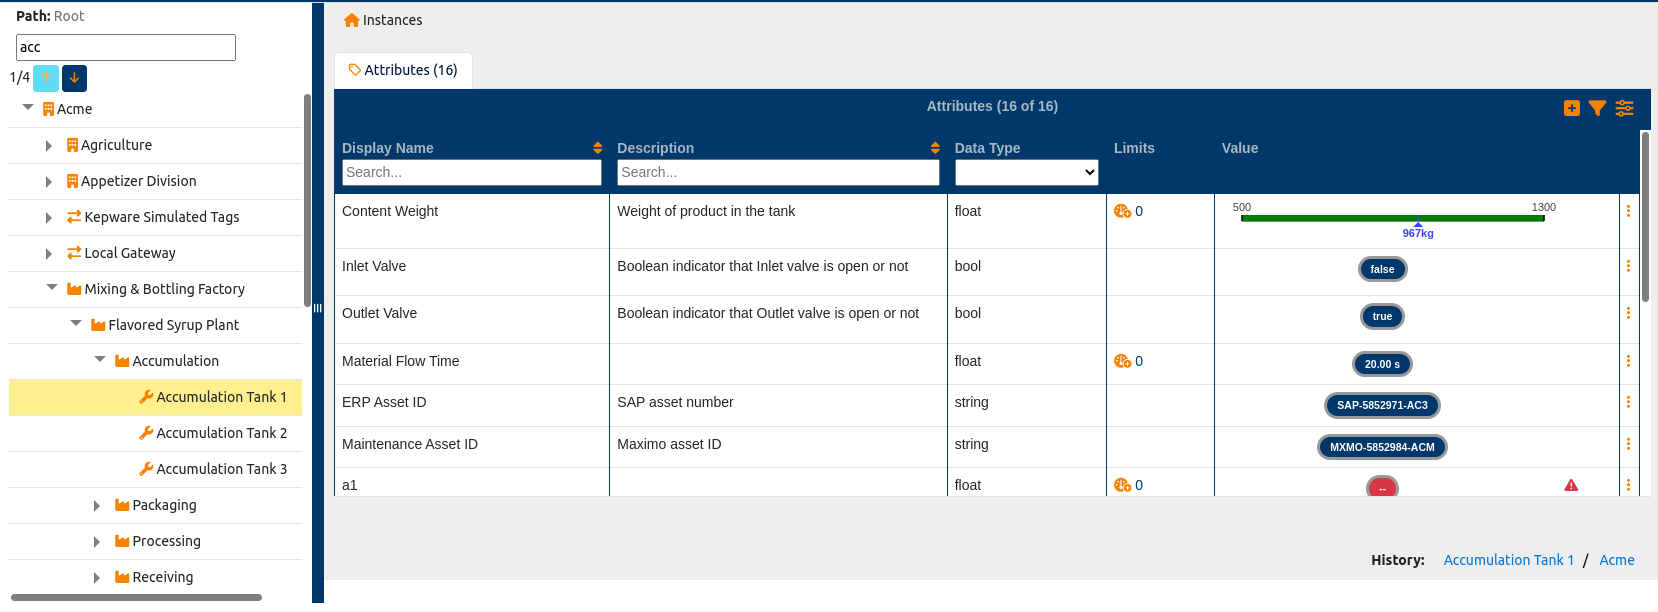
Build the model of your plant: places, equipment, materials and the relationships between them. Every attribute can hold a fixed value, a live measurement or a calculation.
Relationships and Process Layout
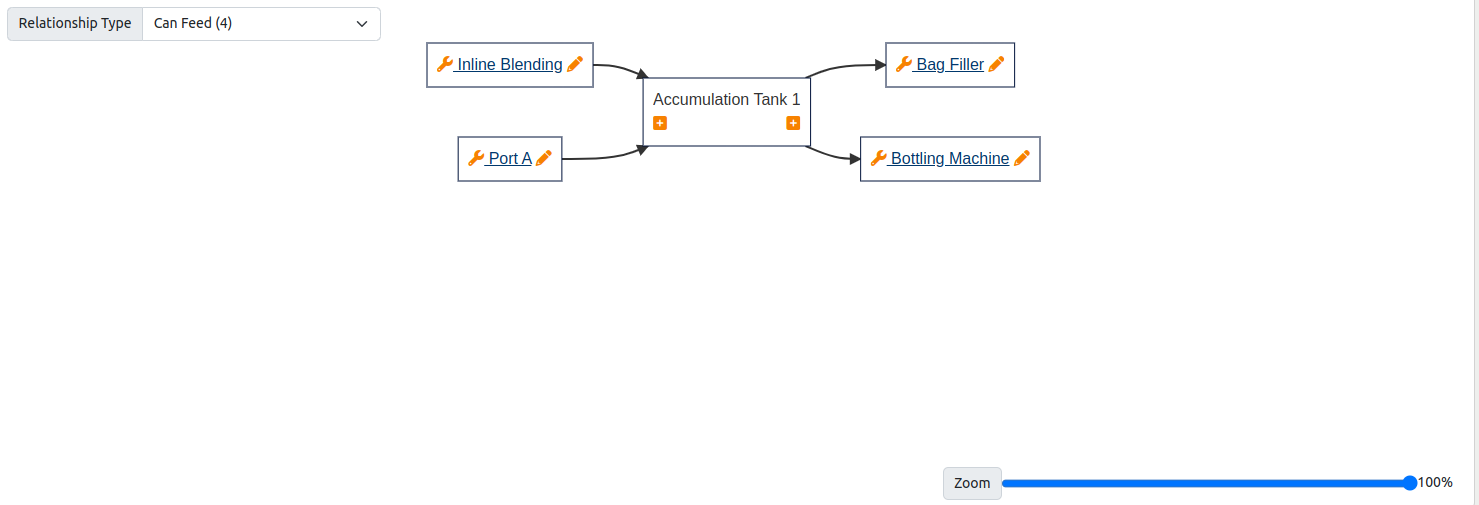
See how your equipment is connected, and draw the whole process from a plant or an area with a Process Layout. Click any item to go straight to its data.
Trend
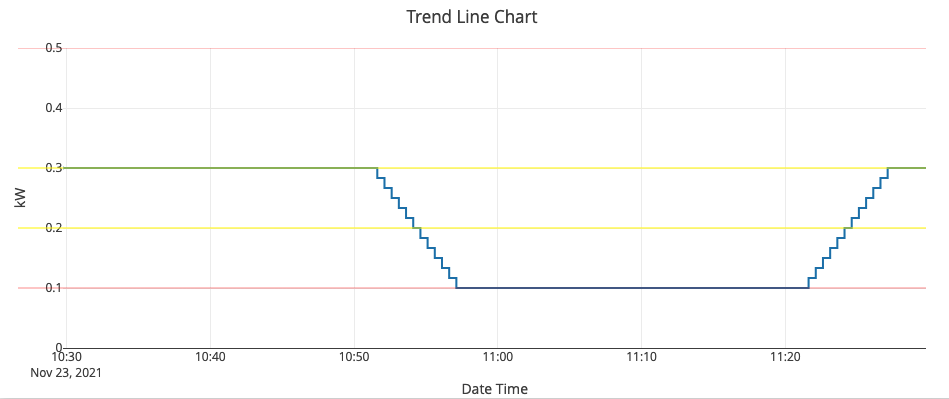
Plot any attribute, live or historical, against any other, with its limits alongside. Pick things by what they are in the model, not by where the data comes from.
Timeseries Dashboard
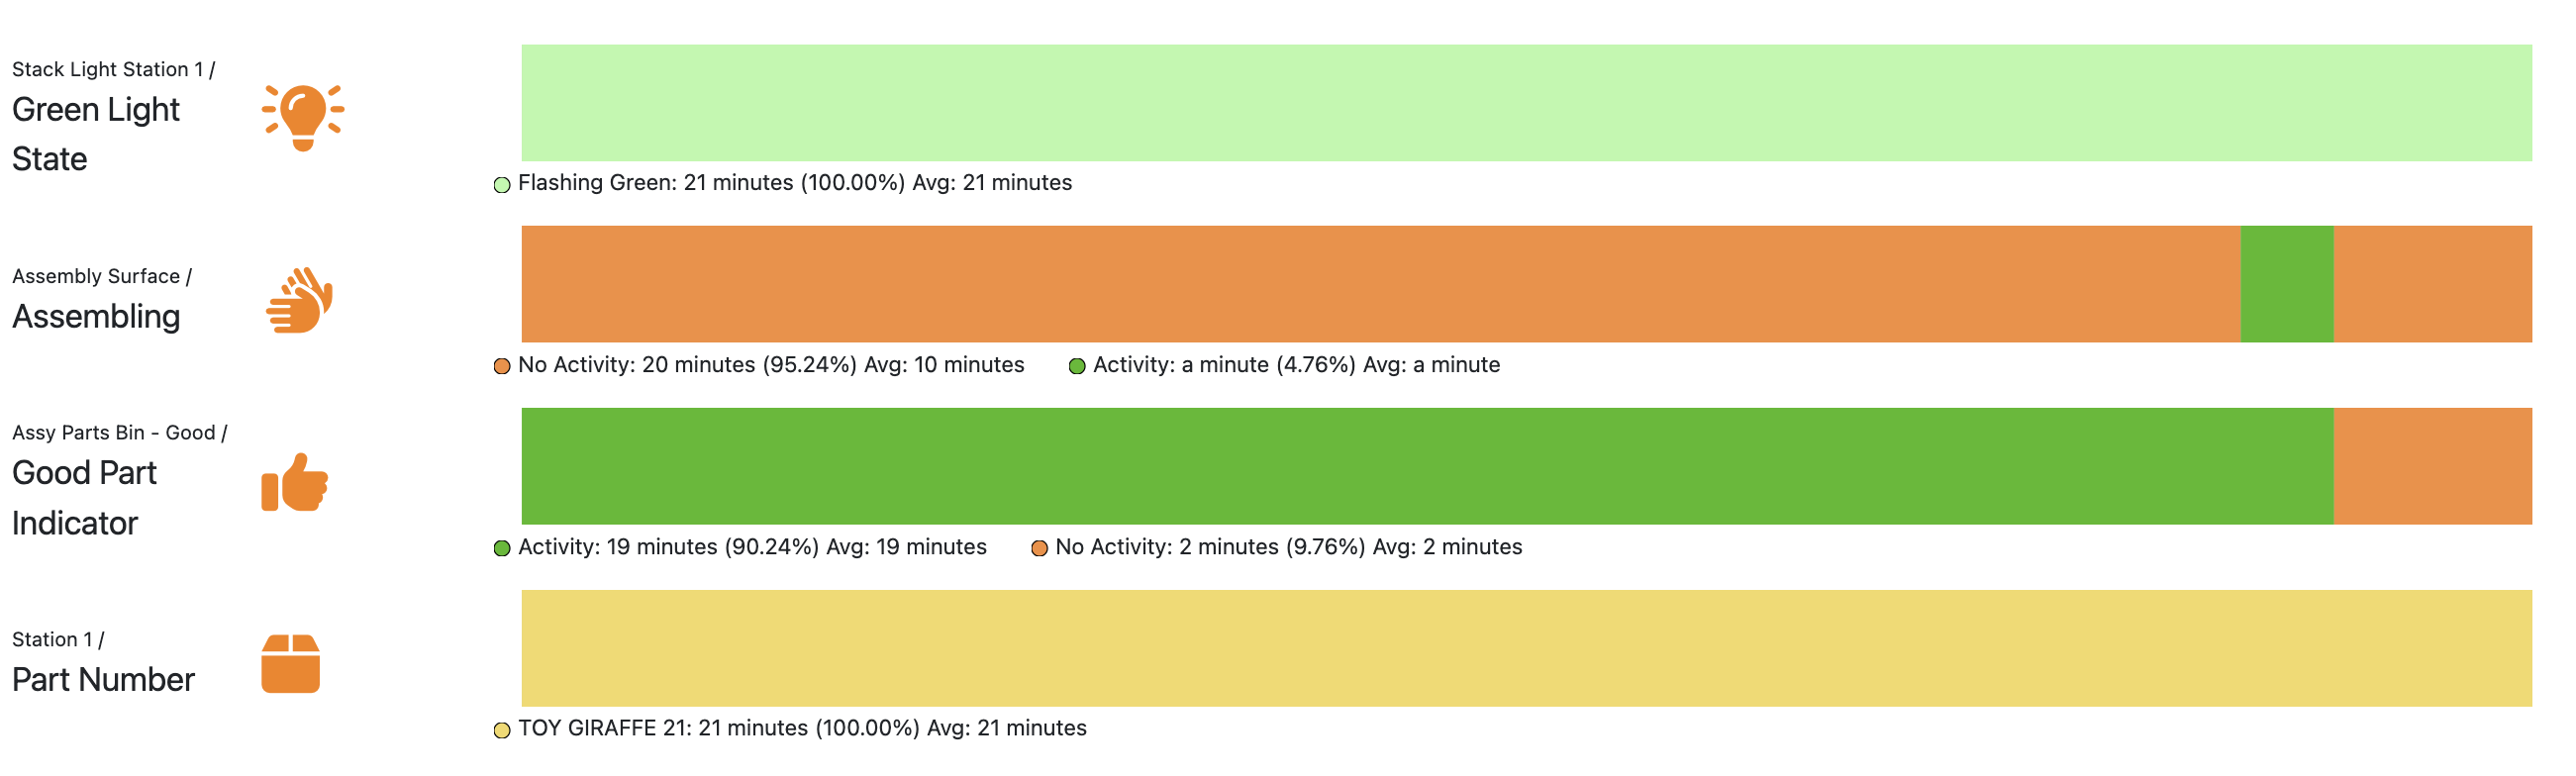
See at a glance how long each piece of equipment spent in each state, such as running, idle or flashing green, over any period you choose.
Where to start
- Open Model Explorer and look at the places and equipment that are already there, or add your own.
- Choose a piece of equipment and look at its attributes. Attributes with a data source show their current value.
- Draw a Process Layout from a plant or an area to see how the equipment is connected.
- Open Trend and plot a few attributes to see how they behave over time.
Use the menu at the top of the page to move between these. Your administrator can change this page at any time: it is an ordinary article.